J.D. Power

ROLE
UX Research Data Analysis Prototype Evaluation Design Consulting
TEAM
Auto Advisory Research Team
DURATION
2024

As a UX Researcher and Design Consultant at J.D. Power, I analyzed large-scale automotive survey data for brands like Ford, BMW, and Volkswagen. I turned raw customer feedback into actionable design recommendations. For Ford, this contributed to a +28% increase in customer satisfaction.

View Impact →
CONTEXT

Cars Are Computers Now

Technology is reshaping how we experience cars. Full self-driving, AI, touchscreens controlling everything from HVAC to navigation — every interaction is digital. But automakers don’t always know what customers actually think about these experiences. That’s where J.D. Power comes in.

Digital Cockpits

Touchscreens replace physical controls. Every tap, swipe, and voice command is a UX decision.

Massive Survey Data

J.D. Power collects feedback from millions of vehicle owners across every brand and model.

The Gap

Automakers have the data but not the insight. Someone needs to translate numbers into design direction.

My Role

My role was that bridge. I took large-scale survey data, identified where vehicles fell short, evaluated prototypes hands-on, and delivered visual evidence that automakers could act on.

Ford BMW Volkswagen
THE PROCESS

The 5-Step Process

I followed a structured research and consulting process — from raw data to delivered recommendations.

STEP 1

Quantifying Performance

I started by identifying where a vehicle excels or falls short against industry benchmarks. Using J.D. Power’s proprietary survey data and probability analysis tools, I could pinpoint exactly which categories — infotainment, driving assistance, interior comfort — scored below the competitive set.

Crosstab analysis showing performance benchmarks

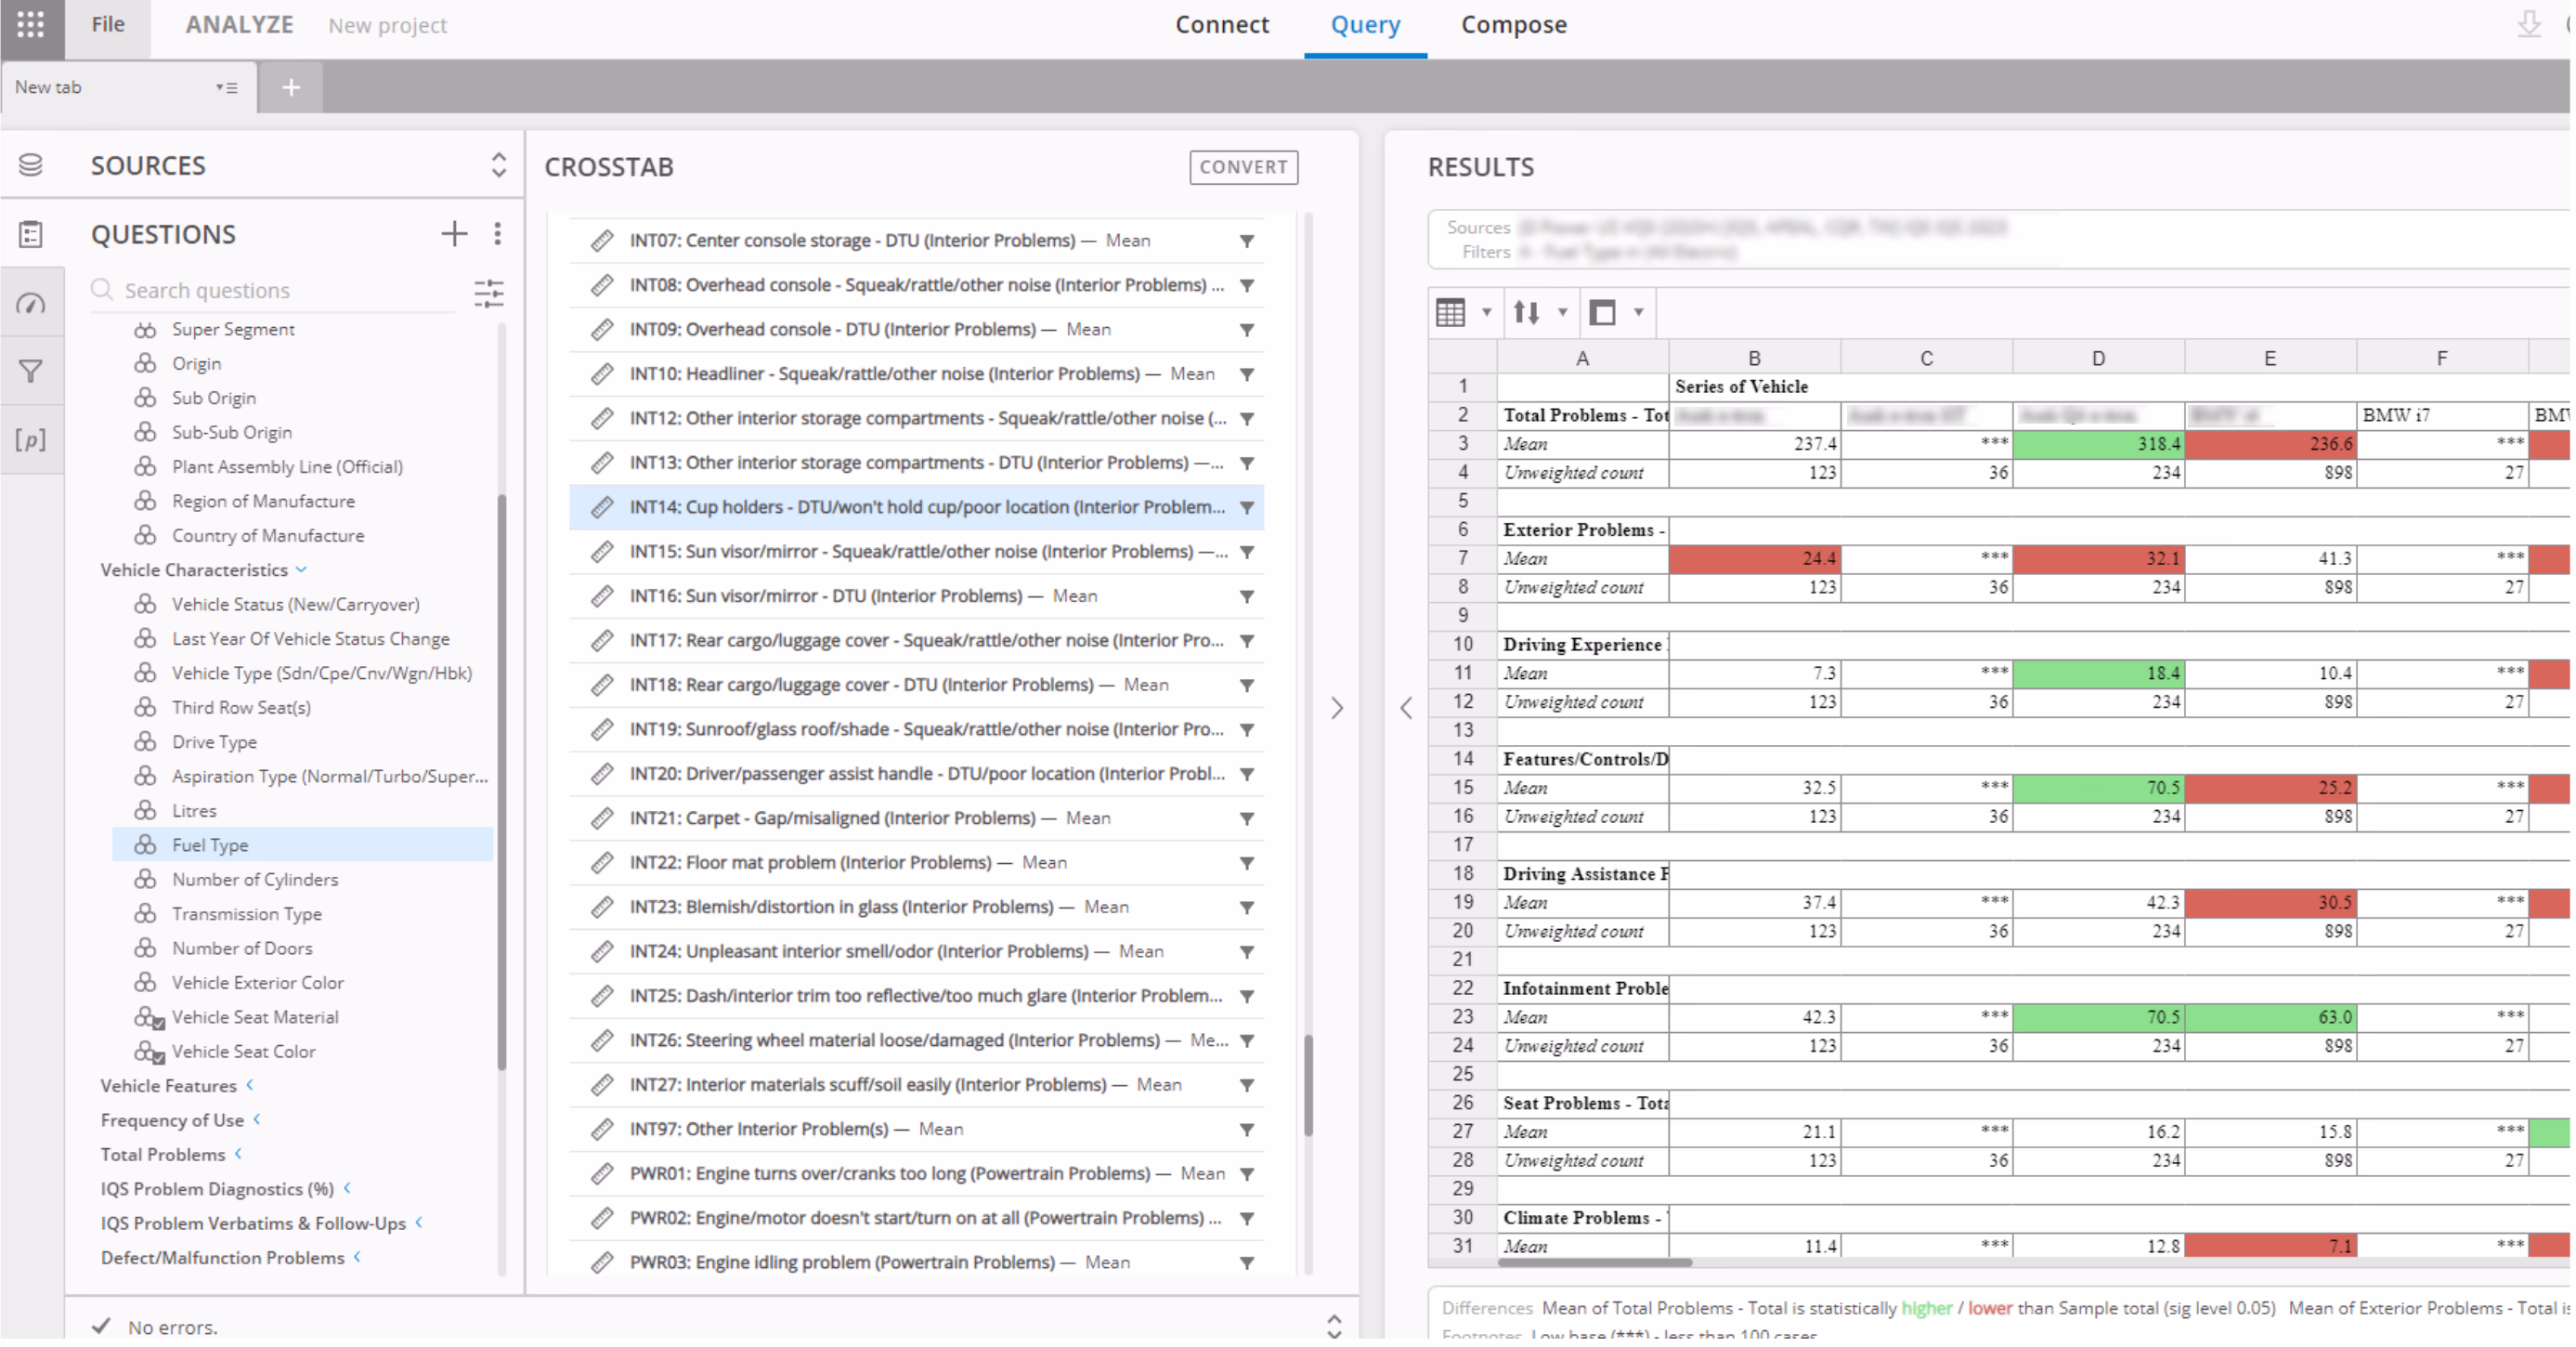
Crosstab analysis: green = above benchmark, red = below. Each row is a UX category.

STEP 2

Understanding the Why

Numbers tell you where the problem is. Verbatims tell you why. I analyzed thousands of customer comments to find patterns — the same frustrations appearing across different owners, different models, different years.

Verbatim Analysis 2023
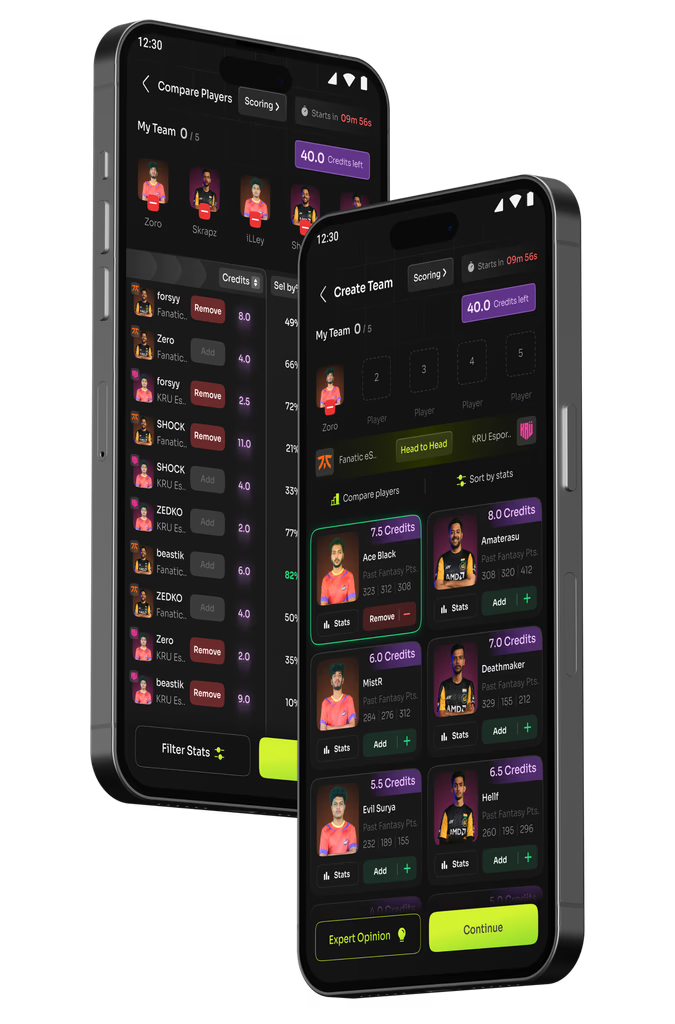
VR Command Recognition — 41 verbatims across 6 themes
Accent Address Slow Random
Accent / Pronunciation
14 34.15% of mentions
“Voice recognition of a non-native English speaker is poor because of the accent differences.”
→ Improve recognition for accents, errors, pauses
Doesn’t Understand VC (Addresses)
12 29.27% of mentions
“It’s not intuitive and difficult to use. Trying to use normally for directions. Keeps saying it doesn’t understand.”
→ Prepare reference guide, improve address interpretation
Slow & Unpredictable
9 21.95% of mentions
“From the time you say ‘ok bmw’ to when it’s ready can be over 5 seconds. System often can’t complete basic commands. Misunderstands things regularly.”
→ Improve response time and consistency
Randomly Starts
4 9.76% of mentions
“The built in voice recognition seems to go off at random times. Too many instances where I am having a conversation in the car and the voice assistance goes off.”
→ Only custom wake word activates VR system
Segment Leader: Audi Q3 hardly has a problem with built-in VR, and provides an intact Carplay/Android Auto voice assistant experience as backup.

41 customer verbatims categorized into 6 themes — each theme mapped to a specific design recommendation

STEP 3

Evaluating Prototypes

With data and verbatims in hand, I evaluated pre-production vehicles at testing facilities. I focused on the specific problem areas the data identified — testing the actual experience against what customers reported.

Hands-on prototype evaluation at testing facility

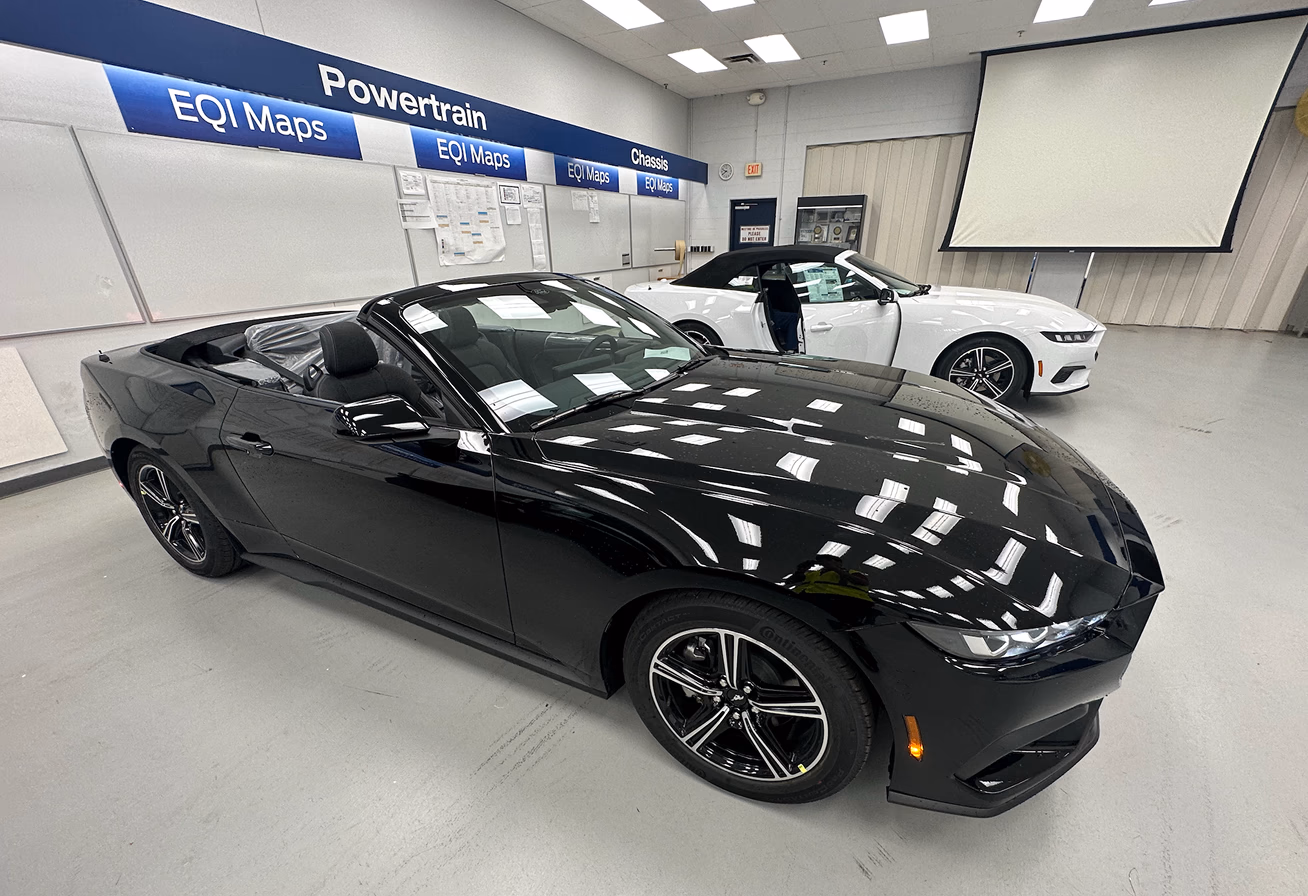
Hands-on evaluation at a testing facility — every annotation maps to a data-backed issue

STEP 4

Building the Case

I combined quantitative data, verbatim themes, and evaluation findings into visual reports. Competitive benchmarks, diagnostic breakdowns, and trend analysis — all designed to make the case undeniable for the client.

Range vs. Time 0 50 100 150 200 250 0 20 40 60 Time (mins) Range (miles) E-tron GT * Mach-E Tesla ID.4
J.D. Power IQS Verbatim Diagnostic — Ford Mustang 57% 19% 17% 7% Slow Charging Connection Problem DC Fast Charger not working App/Software/UX Issue
Time it takes (in seconds) to reach from 0 to 60 mph 0 2 4 6 8 10 APEAL Score 9.9 Tesla Model S (Plaid) 9.7 Tesla Model 3 (Dual Motor AED) 9.9 Tesla Model X (Plaid) 9.7 Polestar 2 (Long Range Dual) 9.7 Tesla Model Y (Long Range AWD) N/A Volvo XC40 (T5 AWD SUV) 9.6 Volkswagen ID.4 (Pure Performance)

Competitive analysis: Range vs. Time, IQS diagnostics, and performance benchmarks across EV models

STEP 5

Delivering Insights

The final step was presenting findings to client teams — often directly to engineering and design leads. I delivered data-backed recommendations, demonstrated issues on prototypes, and provided wireframes for proposed improvements.

HMI wireframe: instrument cluster redesign
HMI wireframe: infotainment redesign

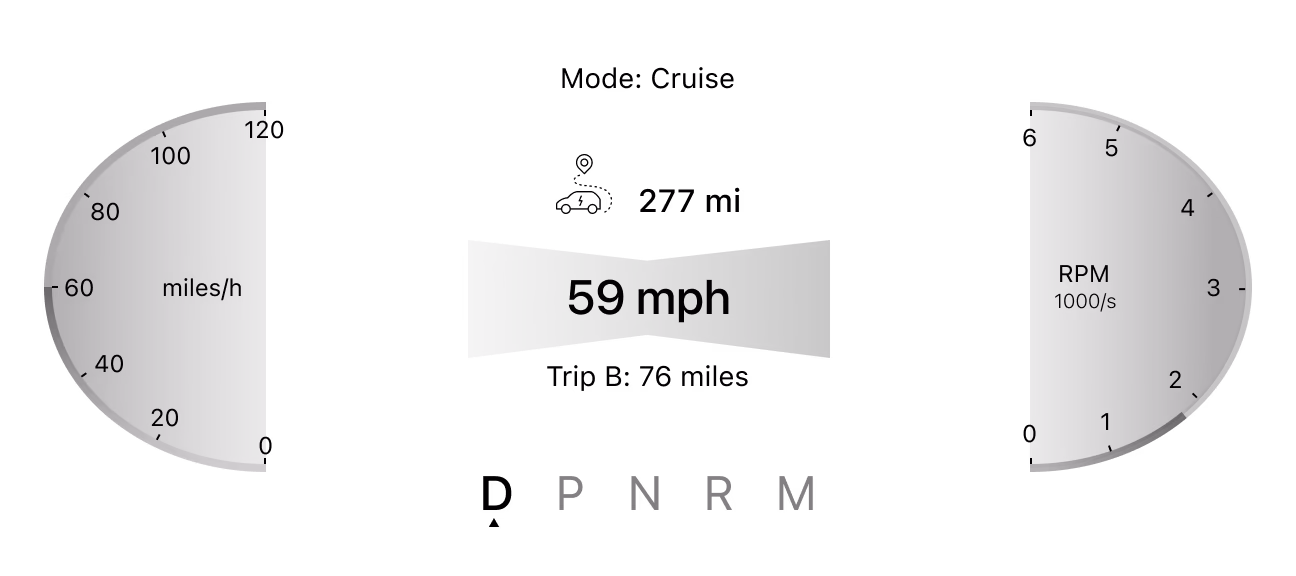
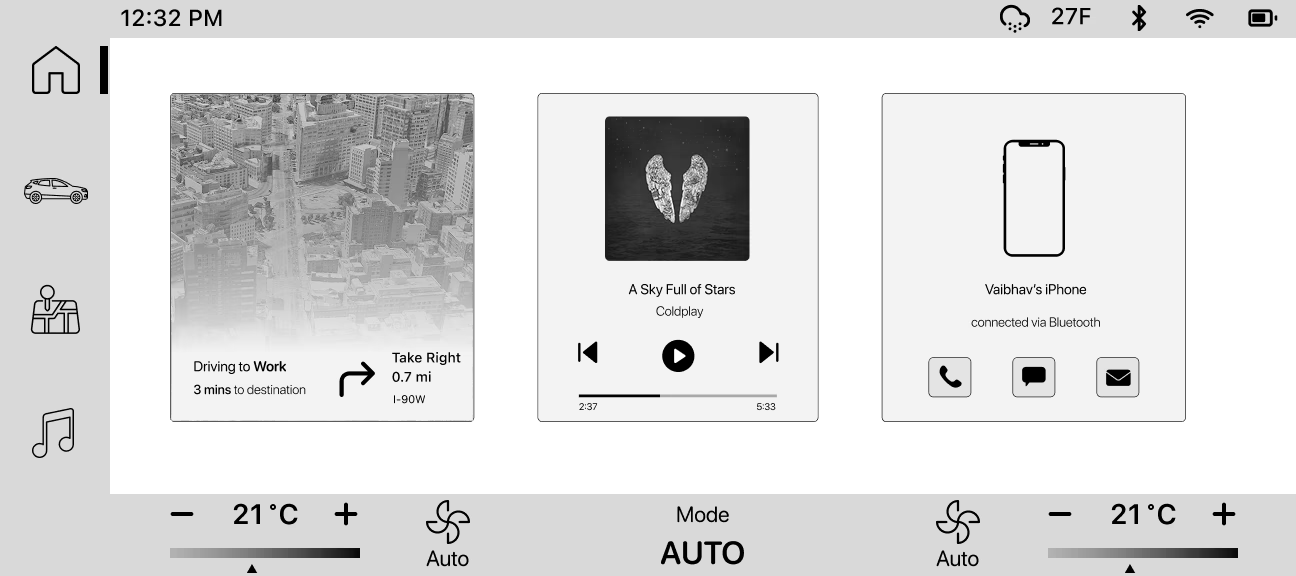
HMI wireframes: instrument cluster and infotainment redesign proposals

Category-level diagnostic deliverable

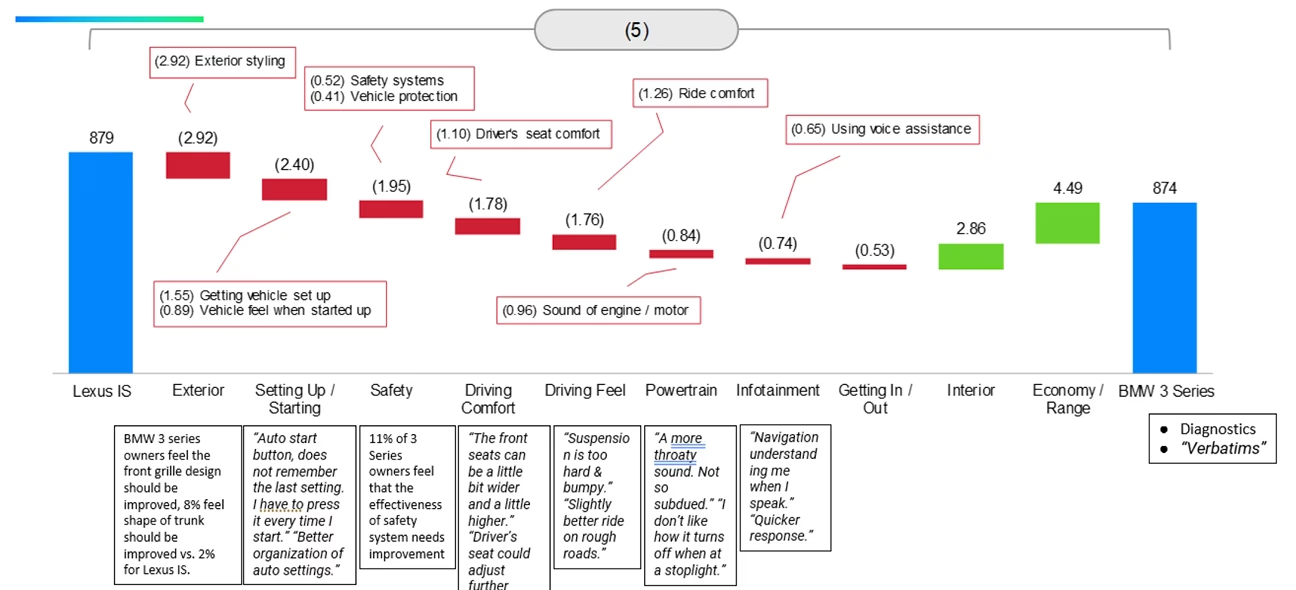
The deliverable: category-level diagnostic with matched verbatim quotes and competitive positioning

IMPACT

Results from Ford

The insights I delivered to Ford were implemented in their next model year. The results:

+28%
Customer
Satisfaction
+33%
Engagement
with HMI
+25%
New Model
Sales YoY
Key Takeaway

In a pay-for-research model, these results validate the entire consulting engagement. The recommendations weren’t theoretical — they were specific enough to implement and measurable enough to track.

MY ROLE

UX Researcher & Design Consultant

I was part of J.D. Power’s Auto Advisory team, working across multiple OEM engagements.

What I Owned

  • Large-scale survey data analysis (probability, crosstab, benchmarking)
  • Customer verbatim analysis and theme extraction
  • Hands-on prototype evaluation at testing facilities
  • Competitive benchmarking and diagnostic reports
  • HMI wireframes and design recommendations
  • Client presentations to engineering and design teams

The Team

  • Auto Advisory Research Team — survey methodology, data pipeline
  • Client Engineering Teams — implementation of recommendations
  • Client Design Teams — HMI and interior design direction
REFLECTION

What I Learned

Verbatims are more powerful than numbers.

A bar chart showing -3.2% in infotainment satisfaction is easy to dismiss. But when you read 50 customers saying “the navigation doesn’t understand me” — that changes a room. I learned to always lead with the human voice, then back it up with the data.

Research without a recommendation is just an observation.

Automakers don’t need more data — they need direction. The most impactful deliverables weren’t the ones with the most charts. They were the ones that said “here is the problem, here is why it matters, and here is what to change.” I stopped presenting findings and started presenting decisions.

Next Project
Fanclash case study preview

Redesigning Fantasy eSports for Real-Money Conversion

UX Research Prototyping A/B Testing